Draw Charts from an Agent
An agent draws a chart by emitting a fenced code block tagged chart whose body is a Chart.js configuration in JSON. The agent’s Inspector tab renders that block as an interactive chart with Chart, Data, and Code views, PNG export, and zoom for cartesian charts. This is a rendering convention: the agent decides when a chart helps and writes the configuration, and the Inspector draws it. No tool call, configuration, or extra code is required.
After reading this page, you will be able to:
-
Emit a chart code block whose body is a Chart.js configuration
-
Instruct an agent to draw a chart through its system prompt
-
Diagnose a chart that renders as an error or stays a placeholder
Prerequisites
-
A deployed agent in Redpanda Cloud. If you don’t have one, see Create an Agent.
-
An understanding of how to write an agent system prompt. See Write Effective System Prompts.
How chart rendering works
When the agent’s response contains a fenced code block tagged chart, the Inspector parses the block body as a Chart.js configuration and draws the chart in place of the code. Every other code block renders as plain code, so a chart block is the agent’s only departure from ordinary output.
The Inspector supplies what the agent leaves out. A bare configuration with a type and data renders with a themed color palette, sizing that tracks the panel, and, for cartesian charts, zoom and pan controls. The Inspector fills only the gaps: a color or an option the agent sets itself is kept as written.
The Redpanda Cloud UI draws a chart block wherever it shows the agent’s response: the agent’s Inspector tab and the Transcripts tab. When an external application calls the agent, whether that application draws the chart depends on how it renders the agent’s output.
Write the chart block
The contract is narrow. Follow it exactly, or the block renders as an error.
-
Tag the fence
chart. The opening fence is three backticks followed by the wordchart, with no other language tag. -
Write the body as strict JSON. The Inspector parses the body with a JSON parser, not a JavaScript evaluator, so the body follows JSON rules: double-quoted keys and strings, unquoted numbers, no trailing commas, no comments, and no JavaScript expressions, functions, or callbacks.
-
Make the body a raw Chart.js configuration. The top level holds a
typefield and adataobject, and an optionaloptionsobject. Do not wrap the configuration in any envelope object.
A minimal bar chart:
```chart
{
  "type": "bar",
  "data": {
    "labels": ["Jan", "Feb", "Mar"],
    "datasets": [
      { "label": "Orders", "data": [120, 190, 140] }
    ]
  }
}
```
This configuration sets no colors and no options. The Inspector supplies the palette, the sizing, and the zoom controls.
Supported chart types
Set type to one of these Chart.js types:
| Type | Use for |
|---|---|
|
Comparisons across categories. Supports zoom and pan. |
|
Trends over an ordered axis, such as time. Supports zoom and pan. |
|
Correlation between two numeric variables, plotted as x/y points. Supports zoom and pan. |
|
Three numeric variables, plotted as x/y points sized by a radius. Supports zoom and pan. |
|
Parts of a whole, as wedges. |
|
Parts of a whole, as a ring. |
|
Parts of a whole, with wedge length scaled by value. |
|
Several metrics for one or more series, on shared axes. |
Instruct the agent through its system prompt
The Inspector draws any chart block the agent emits, so you get charts by telling the agent to emit them. Add the convention to the agent’s system prompt: name the fence tag, state the strict-JSON rule, list the types the agent can use, and give one worked example. Models follow a single concrete example more reliably than a prose description.
The following snippet works as a standalone prompt or as a section added to an existing one:
You can draw charts inline. When a chart communicates better than text,
emit ONE fenced code block tagged exactly `chart` whose body is a Chart.js
configuration as strict JSON.
Rules for the chart block:
- The fence language tag is exactly: chart
- The body is valid JSON: double-quoted keys and strings, unquoted numbers,
no trailing commas, no comments, and no JavaScript, functions, or callbacks.
- The body is a raw Chart.js configuration with a top-level "type" and "data",
and an optional "options". Do not wrap it in any envelope.
- Allowed "type" values: "bar", "line", "pie", "doughnut", "polarArea",
"radar", "scatter", "bubble".
- Omit colors and most "options". The Inspector supplies a color palette,
sizing, and zoom. Set only the options you need, such as a title.
- Put a one- or two-sentence plain-text explanation before the chart block.
Do not also paste a data table; the Inspector has a built-in Data view.
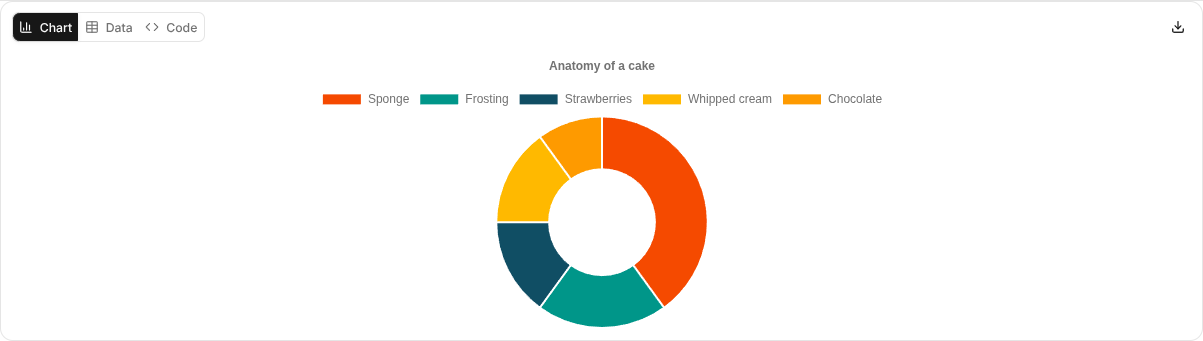
Example response to "show the cake by volume":
A classic layered cake, broken down by volume:
```chart
{
"type": "doughnut",
"data": {
"labels": ["Sponge", "Frosting", "Strawberries", "Whipped cream", "Chocolate"],
"datasets": [
{ "label": "Cake by volume (%)", "data": [40, 20, 15, 15, 10] }
]
},
"options": {
"plugins": { "title": { "display": true, "text": "Anatomy of a cake" } }
}
}
```For prompt-writing patterns that make this output reliable, see Output formatting.
Test the chart in the Inspector
-
Open the agent and switch to the Inspector tab.
-
Enter a prompt that calls for a chart, such as
Show last quarter’s orders by month as a bar chart. -
Wait for the response. The chart appears in place of the
chartblock.
The rendered chart carries a segmented control with three views:
-
Chart: The drawn chart. For a cartesian chart (
bar,line,scatter, orbubble), scroll to zoom, drag to zoom into a region, and, after zooming, drag to pan. A Reset zoom control appears after you zoom or pan. -
Data: The chart’s values as a table, reconstructed from the configuration.
-
Code: The Chart.js configuration the Inspector parsed.
In the Chart view, a download control exports the chart as a PNG file named chart.png.
Set options and colors
The agent can set any Chart.js option. For colors, the palette, and zoom, the Inspector keeps what the agent writes and fills in only what the agent omits, so set these only when the default doesn’t fit.
-
Title, legend, and axis labels: Set them under
options.pluginsandoptions.scales, the same as in any Chart.js configuration. -
Colors: Omit them to take the themed palette, which tracks the light and dark Inspector themes. To fix specific colors, set
backgroundColorandborderColoron a dataset; the Inspector then leaves that dataset’s colors alone. -
Zoom and pan: Cartesian charts get zoom and pan automatically. To turn them off or adjust them, set
options.plugins.zoomyourself.
For the full set of options, see the Chart.js configuration documentation.
Troubleshooting
A block that doesn’t satisfy the contract renders as an inline error that names the problem and shows the body the agent sent, in place of the chart.

| Symptom | Cause and fix |
|---|---|
A Failed to render chart error appears in place of the chart |
The block body doesn’t satisfy the contract. The error message names the problem, and the block below it shows the body the agent sent. Common causes: invalid JSON, such as single quotes, trailing commas, or a comment; a missing |
A Building chart… placeholder doesn’t resolve |
The placeholder shows while the |
The chart renders but the colors look wrong |
The agent set colors that clash with the theme. Remove the |
The agent pastes a table or raw JSON instead of a chart |
The agent either didn’t tag the fence |
