Monitor Data Pipelines on BYOC and Dedicated Clusters
You can configure monitoring on BYOC and Dedicated clusters to understand the behavior, health, and performance of your data pipelines.
Redpanda Connect automatically exports detailed metrics for each component of your data pipeline to a Prometheus endpoint, along with metrics for all other cluster services. You don’t need to update the configuration of your pipeline.
Configure Prometheus
To monitor a BYOC cluster in Prometheus:
-
On the Redpanda Cloud Overview page for your cluster, under How to connect, click the Prometheus tab.
-
Click the copy icon next to Prometheus YAML to copy the contents to your clipboard.
The YAML contains the Prometheus scrape target configuration, as well as authentication, for the cluster.
- job_name: redpandaCloud-sample static_configs: - targets: - console-<id>.<identifier>.fmc.cloud.redpanda.com metrics_path: /api/cloud/prometheus/public_metrics basic_auth: username: prometheus password: "<prom_pass>" scheme: https -
Save the YAML configuration to Prometheus replacing the following placeholders:
-
<id>.<identifier>: ID and identifier from the HTTPS endpoint. -
<prom_pass>: Copy and paste the onscreen Prometheus password.
Metrics from Redpanda endpoints are scraped into Prometheus. The metrics for each data pipeline are labelled by pipeline ID.
-
Use Redpanda monitoring examples
For hands-on learning, Redpanda provides a repository with examples of monitoring Redpanda with Prometheus and Grafana: redpanda-data/observability.
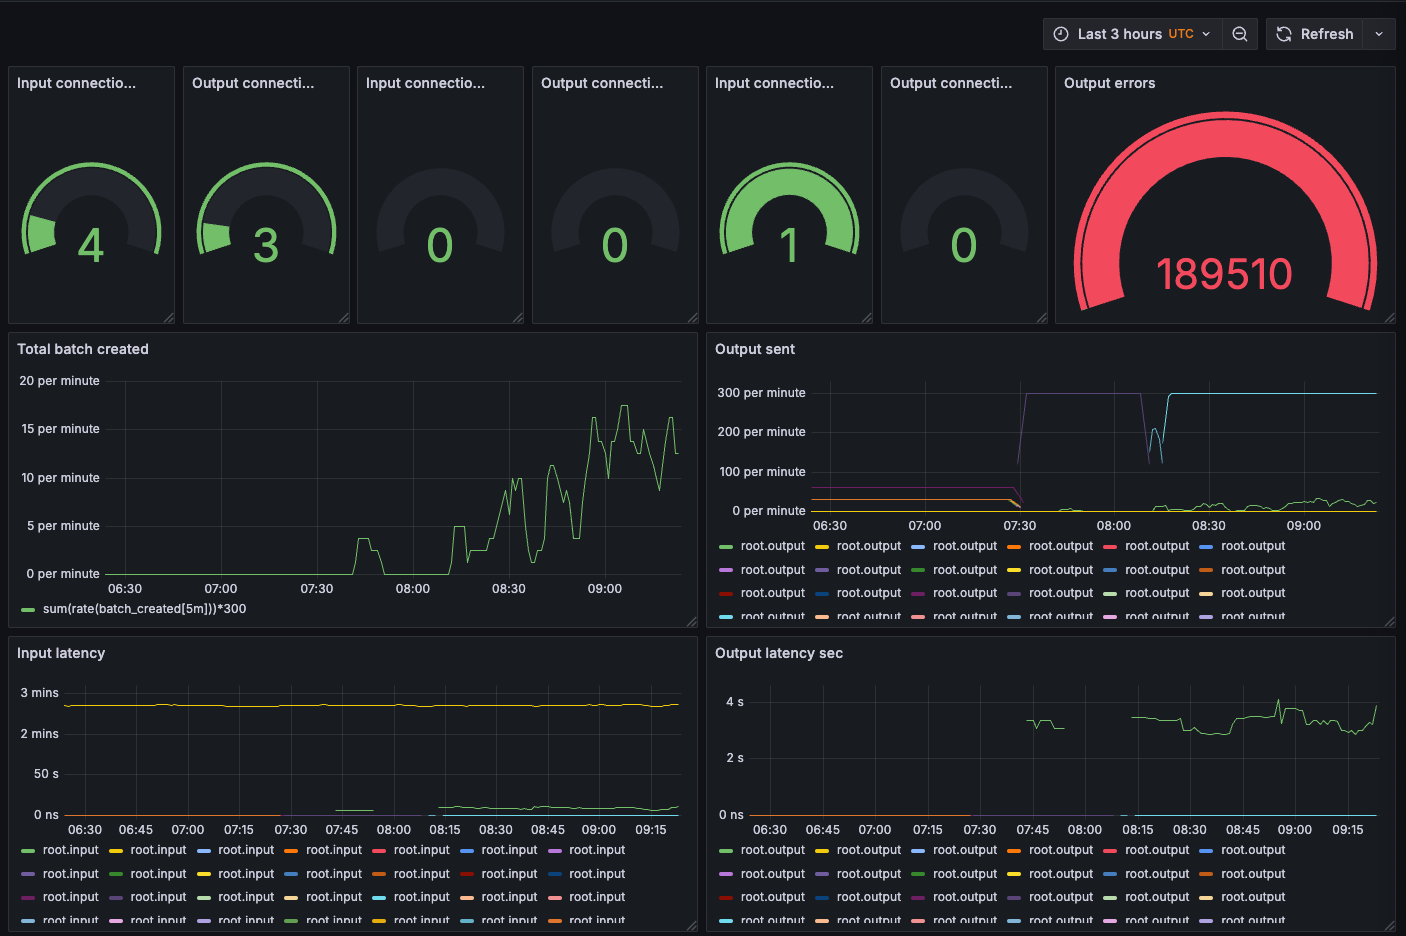
It includes an example Grafana dashboard for Redpanda Connect and a sandbox environment in which you launch a Dockerized Redpanda cluster and create a custom workload to monitor with dashboards.
